
Mukautetut tietojen visualisoinnit Lumossa
- Luetaan
- 2 min
- Kategoria
- Lumo AI
Lumo voi muuntaa laskentataulukot, raportit ja aineistot kaavioiksi, kuvaajiksi ja muiksi visualisoinneiksi suoraan keskustelussanne, jotta voitte ymmärtää monimutkaisia tietoja yhdellä silmäyksellä. Lumo lisää visualisoinnin automaattisesti, kun se on selkein tapa vastata kysymykseenne – esimerkiksi silloin, kun kysytte tietojenne trendeistä, vertailuista tai kuvioista. Tämä toimii sekä lähetettyjen tiedostojen (kuten CSV ja Excel) että tekstipohjaisten kyselyiden kanssa, joihin Lumo voi vastata tiedoilla, vertailuilla tai tilastoilla.
Kuten kaikki muu Lumossa, kaikki mukautetut visualisoinnit ja lähetetyt tiedostot ovat täysin yksityisiä, eikä kukaan muu pääse niihin käsiksi.
Tässä artikkelissa opitte:
- Kuinka luoda mukautettuja tietojen visualisointeja Lumossa
- Kuinka ladata mukautettuja tietojen visualisointeja
- Kuinka poistaa mukautetut tietojen visualisoinnit käytöstä
Kuinka luoda mukautettuja tietojen visualisointeja Lumossa
1. Siirtykää osoitteeseen lumo.proton.me(uusi ikkuna) tai avatkaa Lumon mobiilisovellus ja kirjautukaa sisään Proton-tilillenne.
2. Aloittakaa keskustelu ja kysykää kysymyksenne tai lähettäkää tiedosto tai laskentataulukko Lumolle käsiteltäväksi.
3. Jos visualisointi on paras tapa selittää vastaus, Lumo lisää sen keskusteluunne. Voitte myös pyytää Lumoa luomaan visualisoinnin suoraan, esimerkiksi: ”Muunna tämä analyysi pylväskaavioksi” tai ”Näytä tämä tilasto viivakaaviona ajan kuluessa.”

Tarvittaessa voitte pyytää Lumoa tekemään muokkauksia visualisointiin, kuten vaihtamaan kaaviotyyppiä tai keskittymään tiettyyn tietoalueeseen. Lumo päivittää visualisoinnin automaattisesti ohjeidenne mukaan.
Kuinka ladata mukautettuja tietojen visualisointeja
1. Etsikää Lumo-keskustelustanne visualisointi, jonka haluatte tallentaa.
2. Valitkaa visualisoinnista Lataa (tai latauskuvake).

3. Kun järjestelmä pyytää, tallentakaa tiedosto laitteellenne.
Valmis. Mukautettu tietojen visualisointinne on ladattu, ja se voidaan lisätä esityksiinne, asiakirjoihinne tai mihin tahansa muuhun.
Kuinka poistaa mukautetut tietojen visualisoinnit käytöstä
Jos mieluiten haluatte vain tekstiä sisältäviä vastauksia, voitte poistaa mukautetut tietojen visualisoinnit käytöstä Lumossa.
1. Siirtykää osoitteeseen lumo.proton.me(uusi ikkuna) tai avatkaa Lumon mobiilisovellus ja kirjautukaa sisään Proton-tilillenne.
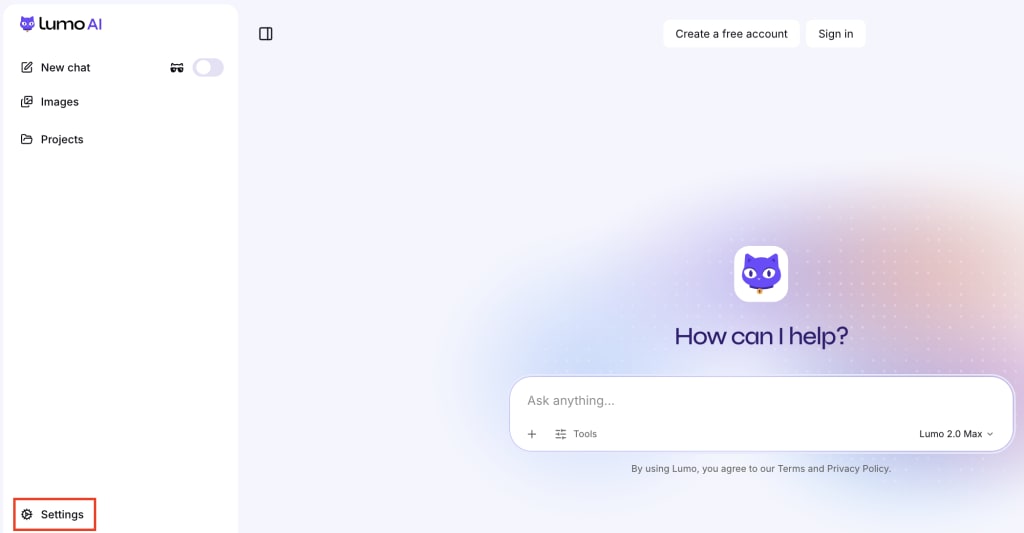
2. Avatkaa Asetukset:
Verkko: Napsauttakaa Asetukset (⚙) -kuvaketta vasemmassa alakulmassa.
Mobiili: Napauttakaa Valikko-kuvaketta (☰) ja napauttakaa sitten Asetukset (⚙).
3. Valitkaa sivupalkista Yleiset . Kytkekää Visualisointitila -kytkin asentoon Pois päältä.

Lumo ei enää luo kaavioita ja muita visualisointeja automaattisesti. Voitte silti pyytää Lumoa erikseen luomaan kaavion tai kuvaajan, jos tarvitsette sellaisen.